
Resume: In accordance with the data of the National Statistics Office of Georgia, the population’s average monthly real incomes increased by 6.7% in 2018 as compared to 2013. Of note is that the population’s real incomes decreased in 2017 and 2018.
In 2018, the real GDP per capita increased by 21% as compared to 2013. Although, of note is that since 2013, after the change of government, Georgia’s economic growth rate has slowed down.
In 2018, the share of the population living in absolute poverty decreased from 26.2% to 20.1% as compared to 2013. The poverty reduction trend started in 2011 and continued until 2016. In 2016 and 2017, the level of poverty in Georgia increased whilst the share of the population living in poverty decreased again in 2018.
In 2018, the level of the quality of life as well as the population’s incomes increased as compared to 2013 although the increase was not significant. In addition, we have to take into account that the population’s real incomes have decreased in the last two years.
Analysis
The Deputy Minister of Finance, Giorgi Kakauridze, at the sitting of the Budget and Finance Committee of the Parliament of Georgia, stated that “both the level of the quality of life and the population’s real incomes have significantly increased as compared to 2013.”
In accordance with the data of the National Statistics Office of Georgia, the population’s average monthly nominal incomes (in monetary and non-monetary forms) increased annually in 2013-2018. The real incomes of the population (considering inflation) increased in 2013-2016 and decreased in 2017 and 2018. According to 2018’s data, the population’s real incomes have increased by 6.7% in total as compared to 2013 (see Graph 1).
Graph 1: Population’s Average Monthly Incomes in 2013-2018
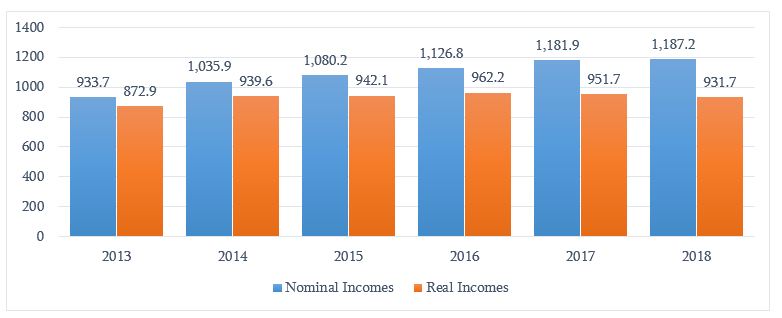
Nominal Incomes Real Incomes
Source: National Statistics Office of Georgia
In accordance with the data of the National Statistics Office of Georgia, Georgia’s real GDP per capita increased annually in 2013-2018. In 2018, the GDP per capita increased by 21% as compared to 2013 (see Graph 2).
Of note is that under the Georgian Dream’s rule, Georgia’s economic growth rate has slowed down. In 2004-2012, Georgia’s real GDP increased annually by 6.2% on average. In 2013-2018, the real GDP growth constitutes 3.9% (see FactCheck’s article).
Graph 2: Real GDP Per Capita in 2013-2018 (Thousand)
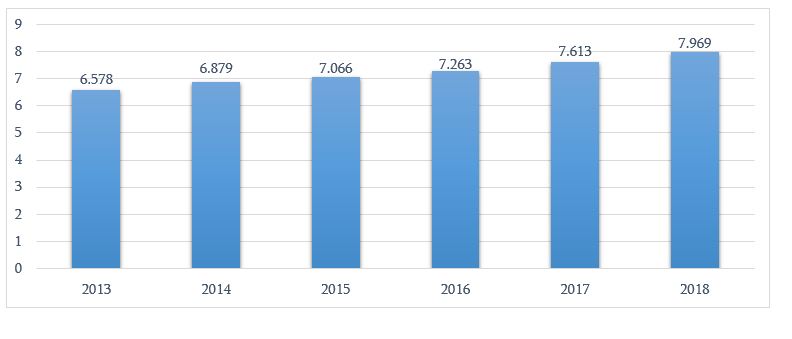
Source: National Statistics Office of Georgia
Speaking of the quality of life, of note is that poverty remains Georgia’s principal challenge. In 2011-2015, there was a poverty reduction trend in the country although the poverty level did increase in 2016-2017. In 2018, the share of the population living in poverty decreased again (see FactCheck’s article).
According to 2018’s data, 20.1% of Georgia’s population lives below the absolute poverty[1] line and this figure was 26.2% in 2013. In 2018, relative poverty[2] was 20.5% which is 1% less as compared to 2013’s figure.
[1] Absolute poverty shows what part of the population lives below the subsistence minimum. The official figure of the subsistence minimum is a threshold of absolute poverty.
[2] Relative poverty shows the relationship between the population’s incomes and expenses and the median consumption level in a country. Those who consume less than 60% of the population’s median (average) consumption are considered to be living in poverty.