
Resume: The Minister of Economy and Sustainable Development of Georgia, Giorgi Kobulia, discusses the changes of the nominal GDP (PPP) indicators in time and the figures in his statement are in line with statistical data. However, the use of the GDP (PPP) for analysis in time; that is, using the PPP figures to compare two different years, is wrong because this nominal indicator[1] encompasses the inflation effect and is irrelevant for analysis. At the same time, the GDP (PPP)[2] is measured for comparison between different countries and not for the evaluation of the changes of one single country’s economy in time.
As mentioned previously, for the comparison of changes in a country’s economy (without comparing the performance of other countries), the GDP (PPP) in both nominal and constant prices is not a proper indicator. The only correct indicator for analysing the changes and trends of the economy in time is the real GDP (in the national currency and in constant prices). In 2017, Georgia’s real GDP was GEL 28.3 billion which is 1.2 times more as compared to the same figure in 1991 (the final year of the Soviet Union). Therefore, this does not mean that Georgia’s economy doubled in 1991-2017.
Analysis
The Minister of Economy and Sustainable Development of Georgia, Giorgi Kobulia, during the Committee Hearings at the Parliament of Georgia, stated: “Georgia’s economy, in terms of its purchasing power, is twice as big as it was before the collapse of the Soviet Union.”
Several economic metrics (nominal GDP, real GDP and GDP PPP) are used to measure the economic wealth created in a country. Of these metrics, none of them can be applied universally and they have to be used selectively. Each and every one of them is best to assess the economy in a specific direction. The gross domestic product (GDP) depicts the value of the goods and the services produced in a country in a certain period of time. In his statement, Giorgi Kobulia refers to the nominal GDP in purchasing power parity (PPP). However, the aim of calculating the GDP with purchasing power parity and measuring GDP (PPP) per capita figures is to compare economic situations in different countries. Therefore, if the aim of the analysis is not to make a comparison vis-à-vis other countries, then the discussion about the GDP (PPP) converted to international dollars becomes irrelevant. On the other hand, the Minister speaks about the nominal figures of the GDP but comparing these figures in time is incorrect because they encompass inflation (rising prices) and, therefore, do not give a real picture. This means that the volume of the GDP in monetary figures is increased but it does not show the extent to which the volume of those produced goods and services has increased or decreased.
There are GDP (PPP) indicators in constant prices which are free from the inflation influence but which allow the possibility to have a constant disposition of prices in different countries which is a very rough assumption and complicates the understanding of the real picture. At the same time, because of the methodology, this figure is a copy of the real GDP growth rate. The GDP (PPP) in constant prices is a compromise indicator and is used for specific purposes alone. In particular, the GDP (PPP) is used for analysis in time in order to compare the economic positions of one single country vis-à-vis others. Therefore, it is irrelevant to use the GDP (PPP) for the analysis of one single country’s economic trends. In order to analyse the volume of the economy and the economic growth rate of one particular country (in this case Georgia) over the years, we have to take a look at an indicator calculated in constant prices; that is, the real GDP.
Georgia obtained independence in April 1991 whilst the Soviet Union was dissolved in December of the same year. In 2017, Georgia’s GDP was GEL 28.3 billion. The difference between Georgia’s real GDP in 1991 (the final year of the Soviet Union) and 2017 is only GEL 4.6 billion as Georgia’s GDP in 1991 was GEL 23.7 billion. Therefore, from the final year of the Soviet Union to 2017, Georgia’s real GDP only increased by the factor of 1.2.
Graph 1: Georgia’s GDP and Economic Growth Rate (GEL Million, %)
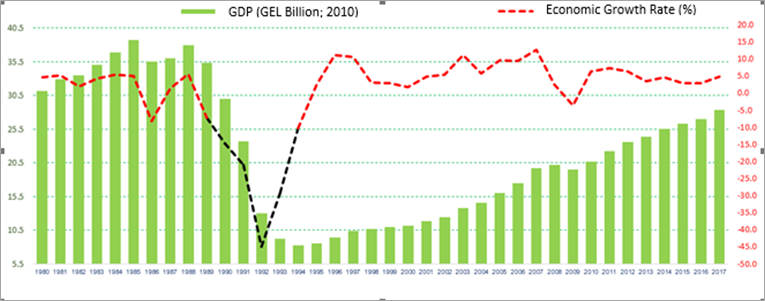
Source: World Bank
In 1989, Georgia’s economy started shrinking. Georgia’s economy in 1989 decreased by 7.2% as compared to the previous years and continued to decline in the next years. The country’s economy only resumed growth in 1995 when the economic growth rate was 2.5%. Georgia’s economy shrank the most in 1991-1993 and decreased by 76.8% between 1989-1994.
After the so-called “perestroika,” the Soviet economy in general started to collapse. In 1986, it was the first time when the economy decreased whilst declines were abetted in 1989. In 1991, the economies of almost all of the 15 Soviet countries decreased but the downward fall was the greatest for Georgia at 21.1%. In this period, the economies of all of the Soviet countries were generally shrinking although Georgia’s dropped further below as compared to the rest which was related to a myriad of domestic and foreign challenges facing the country in that period.
Graph 2: Economic Growth Rate of the former Post-Soviet Countries (%)
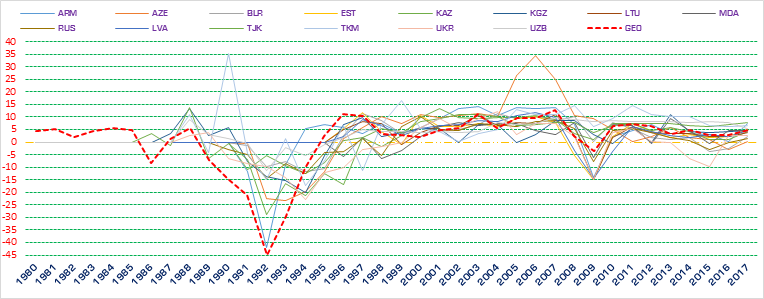
Source: World Bank
[1] Indicator given in current (market) prices.
[2] Calculations for the GDP (PPP) include that one and the same currency has a different purchasing power in different countries based on the wealth of these countries.