

Resume: At the time of Mamuka Bakhtadze’s statement, Georgia’s estimated current account deficit for 2019 was not 4.5% but 7.5%. Taking the whole world into account, there were cases of greater reductions in current account deficits in different economies as compared to Georgia’s case. Therefore, dubbing it as an “unprecedented success” is a lie. In addition, for comparison with Georgia, of note are the cases of Armenia, Estonia and Ireland which witnessed reductions in their current account deficits in higher percentage points as compared to the estimated figure for Georgia.
In turn, the reduction in the current account deficit in Georgia in the last years has largely been associated with the trade balance; in particular, with the trade in services where the export growth rate is high and which in turn is stipulated by the tourism growth rate. Of further note is that in the component of goods, the rate of export and import has not been changed substantially apart from this and the past year. In 2013, the current account deficit was much lower as compared to the 2018-2019 figures. In 2013, the current account deficit amounted to 5.92% of the GDP which was stipulated by decreased consumption and, therefore, a drop in imports. The latter is not an indicator of the improvement in the population’s well-being. Therefore, the decreased current account deficit may not be a positive thing in every instance.
Analysis
The former Prime Minister of Georgia, on his resignation day, spoke about economic achievements at a meeting with journalists. The former Prime Minister also touched upon the current account deficit. Mamuka Bakhtadze stated: ““In the course of this year, the current account deficit shrank from 13% to 4.5% (estimate for 2019) which is an unprecedented success all over the world.”
The current account is part of the balance of payments. The latter is a statistical account which details economic relations and transactions between a particular country and the rest of the world. The current account itself includes goods and services, and primary and secondary revenues. This means that a current account shows the difference between a country’s trade balance and revenues. It is the trade balance that constitutes the main part of the current account and shows whether or not production exceeds consumption in a country. In the case of Georgia, goods and services produced are less as compared to consumption. Therefore, Georgia has a negative trade balance meaning that the import of goods and services exceeds export. In this case, the current account runs with a deficit and is primarily affected by changes in export and import. In turn, sources to offset the deficit are capital transfers, foreign investments and foreign debt. This is put into capital and financial accounts. Of note is that there are several “natural” and “artificial” reasons behind a decrease in a deficit. As mentioned previously, most of a current account is the export-import balance and, consequently, a stricter trade policy is largely assumed as belonging to the “artificial” reasons for a deficit reduction. In regard to “natural” causes, they are mostly as follows: a high growth rate in export sectors (positive), decreased import as a result of a drop in local consumption (negative) and changes in a national currency’s real exchange rate vis-à-vis the world’s major trade currencies.
A current account deficit/surplus is measured by its ratio to the GDP in order to make a comparative analysis over time. In turn, a negative figure shows a current account deficit whilst a positive figure shows a surplus. In 2000-2018, Georgia’s current account was running with a deficit which was -10.9% of the GDP on average. In the first five years of that period in 2000-2005, the current account deficit was comparatively low. Since 2005, the current account deficit has started to increase and reached -21.96%. In that period, the growth of the deficit was related to a significant growth in local consumption which affected the trade balance. In particular, import has been growing more rapidly as compared to export (this period is characterised with a comparatively higher economic growth rate). However, since 2009 the current account deficit has been decreasing and stood at -11.39% on overage in 2009-2012.
Graph 1: Georgia’s Current Account Deficit (USD Million, %)
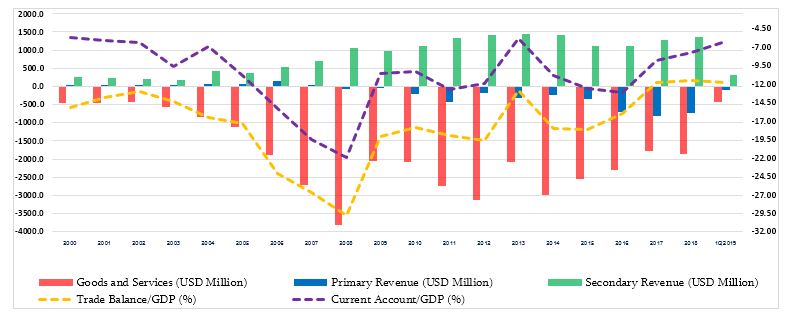
Source: National Bank of Georgia
In 2013, the current account deficit was -5.92% of the GDP which was the lowest figure since 2000. The reason behind the decreased deficit in 2013 was changes in export and import as compared to the previous period. In particular, the import of goods and services increased by 1.34% (USD 122.6 million) in 2013 whilst export increased by 19.11% (USD 1,150.6 million). Separately, the picture in terms of the export and import of goods component was as follows: in 2013, the import of goods increased by 0.15% (USD 11.8 million) whilst export increased by 21.15% (USD 731.7 million). This does not indicate an improvement of the well-being of the country’s population because the decrease in import was caused by a reduction in local consumption instead of meeting demands with local production. In 2013, the real figure of private consumption decreased by 0.08% whilst the total GDP increased by 3.4% and this was the result of increased foreign demand. The latter contributed to the higher growth rate of export. In turn, in the export component, the significant growth was related to the export of goods where tourism figures had a notable and significant impact. After all the aforementioned, the current account deficit constituted 13.15% of the GDP in 2016. The former Prime Minister, in his statement, refers to that year whilst making the comparison with the estimated figure for 2019. In turn, the current account deficit worsened by 0.52 of a percentage point as compared to the previous year and this was caused not by a trade deficit but by a decrease in primary income.
Graph 2: Georgia’s Trade Balance, Goods Component Only (USD Million, %)
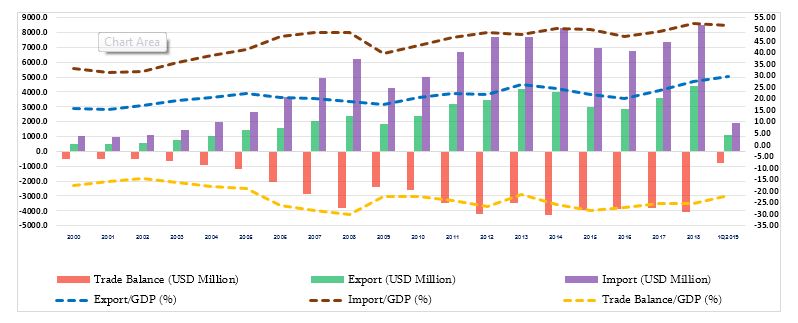
Source: National Bank of Georgia
The estimated current account deficit for 2019 is 7.5% of the GDP instead of 4.5% as stated by Mamuka Bakhtadze (existing estimate at the time of the statement). In regard to 2020, the estimated current account deficit is 7.3% of the GDP.
Graph 3: Georgia’s Trade Balance, Services Only (USD Million, %)
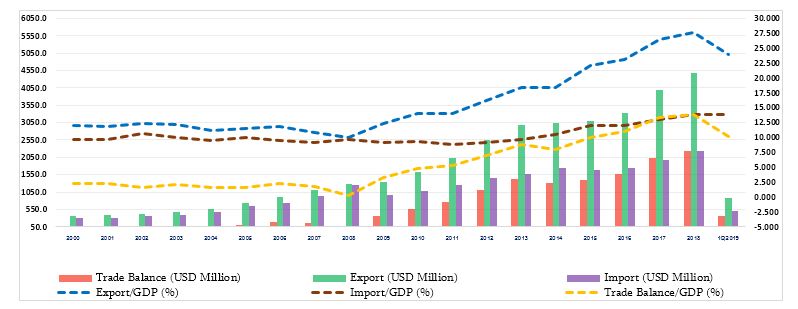
Source: National Bank of Georgia
There are multiple economies in the world which decreased their current account deficit in a two-to-three year time span with much more percentage points as compared to the decrease in Georgia’s case. Therefore, the former Prime Minister’s statement where the decrease of the deficit is stressed as an “unprecedented success all over the world” is a lie. Furthermore, the reduction in the current account deficit does not give information about the improvement of the economic situation. As mentioned previously, one of the reasons for a decrease in a current account deficit could be a drop in local consumption and, consequently, in imports, which on the contrary indicates a deterioration of a population’s economic situation.
In 1998-2018, Armenia had a current account deficit which constituted 8.95% of the GDP on average. Armenia had its highest deficit figure in 1998-2001 when the average figure was -16.28%. In the following two years, the deficit decreased to almost -6% whilst it decreased further to -2.38% on average in 2004-2006. However, during the world financial crisis, Armenia’s current account deficit increased and reached -16.48% in 2009. Since 2010, it has been characterised with a decrease trend and in 2016 it even dropped to -2.26%. Therefore, Armenia’s economy has had a higher percentage figure of reduction in its current account deficit as compared to Georgia’s case.
Graph 4: Current Account Deficit in Georgia and Other Countries (%)
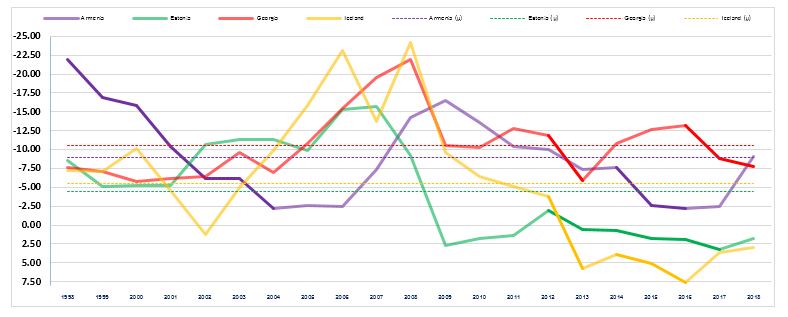
Source: World Bank, International Monetary Fund
In 1998-2018, Estonia had a current account deficit and it was -9.77% on average. Since 2009, Estonia’s current account is in surplus and it constitutes 1.39% of the GDP. Estonia had the highest deficit in 2002-2008 when it was -11.91% on average. It has been changed into a surplus since 2009 and constituted 2.67% of the GDP. Therefore, Estonia’s economy also had a case when the current account deficit decreased with more percentage points as compared to Georgia.
In 1998-2012, Ireland had current account deficit and it was -9.62% on average. Since 2013, Ireland’s current account is in surplus. In the deficit year, the highest figure was registered in 2008 at -24.23% which decreased the following year by 14.68 percentage points. In addition, there was a big deficit figure in 2008 at -23.08 which decreased by 9.35 percentage points in 2007. In 2012, Ireland’s current account was 3.75% of the GDP which decreased by 9.52% in 2013 and turned into surplus. Therefore, Ireland’s economy has also registered improvement in its current account deficit with higher percentage points as compared to Georgia.