Resume: In order to measure the agricultural sector under the Georgian Dream’s rule, FactCheck compared 2012’s indicator to the one of 2018.
In 2018, the production of one-year crops shrank and only wheat production increased as compared to 2012. Of multi-year crops, there is growth in grape production although a decrease in the production of fruit and citrus. There is also a clear-cut decrease trend in the amount of sown areas. In regard to products of animal husbandry, there is a drop in milk production although an increase in the production of meat and eggs.
In order to assess the situation in the agricultural sector in general, on the one hand, we need an analysis of the real agricultural growth rate (how the sector’s output alters excluding the impact of price changes) and, on the other hand, the share of agriculture in the total economy of the country; that is, the share it occupies in the gross domestic product. In accordance with the preliminary data of 2018, the total domestic product created in the agricultural sector amounted to GEL 1,759 million in constant prices which is GEL 12.7 million (0.7%) more as compared to the same figure of 2017. In regard to the statistics of the last years, the highest figure for the real agricultural growth since 2012 was registered in 2013 when growth constituted 11.3% as compared to the previous year (agriculture decreased by 3.8% in 2012). Since 2013, the real agricultural growth rate has been characterised with a decrease trend and dropped by 3.8% in 2017 instead of showing any growth. As mentioned previously, the real agricultural growth rate was only 0.7% in 2018.
In addition, the share of agriculture in the gross domestic product has been decreasing annually since 2013 and amounted to 7.7% of the total economy in 2018 (it was 8.6% in 2012, 9.4% in 2013 and 8.2% in 2017) which means that other sectors of the economy have increased faster as compared to agriculture. It is possible to say that under increased funding in 2013-2018, the agricultural sector increased only marginally in absolute figures whilst the agriculture to total economy ratio decreased.
Analysis
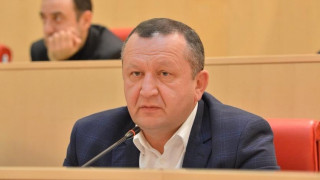
At the sitting of the Budget and Finance Committee of the Parliament of Georgia, Davit Chichinadze, MP, assessed the agricultural sector and stated: “All kinds of crops have decreased in agriculture. For instance: wheat, corn and fruit. The only growth is in the grape yield. Let us take milk. In accordance with the data of the National Statistics Office of Georgia, 650 million litres were produced in 2007 and 550 million litres in 2018. And all of this is against the backdrop of spending a large amount of money in agriculture.”
In accordance with the preliminary data, Georgia’s total agricultural output in 2018 was GEL 4 billion which exceeds the 2017 figure by 6.4% and the 2012 figure by 43.8%. Since Davit Chichinadze provides a general assessment of how the agricultural sector developed under the rule of the incumbent authorities and he underlines a decrease in crop yields, FactCheck analysed one-year and multi-year crop production statistics and compared the 2018 figure to that of 2012. Statistically speaking, there is no clear-cut trend in production of one-year crops. As compared to 2012, only wheat production has increased whilst the production of other one-year crops has decreased. As compared to 2017, there is growth in the production of wheat, corn and vegetables whilst there is a decrease in the production of potatoes.
Table 1: Production of One-Year Crops (Thousand Tons) in 2012-2018
|
Year |
Wheat |
Corn |
Potato |
Vegetables (in total) |
|
2012 |
80.7 |
267 |
252 |
198.5 |
|
2017 |
97.9 |
142.5 |
180.1 |
125.9 |
|
2018 |
107.1 |
194.2 |
137.5 |
142.2 |
Source: National Statistics Office of Georgia
In regard to the sown areas of spring and autumn crops, the total amount of sown areas in 2012 increased as compared to 2012. However, a decrease trend has become evident in the following years.
Table 2: Sown Areas (Thousand Hectares) of Spring and Autumn Crops in 2012-2019
|
Year |
Sown Areas (Total) |
Autumn |
Spring |
|
2012 |
259.6 |
54.1 |
205.5 |
|
2018 |
207.1 |
54.5 |
152.7 |
|
2019 |
193.6 |
52.1 |
141.5 |
Source: National Statistics Office of Georgia
As compared to 2012, the production of citrus and fruit decreased in 2018. Only grape production has increased and even here there is no clear-cut trend. As compared to 2017, the production of fruit in general has increased.
Graph 1: Fruit Production (Thousand Tons) in 2012-2018
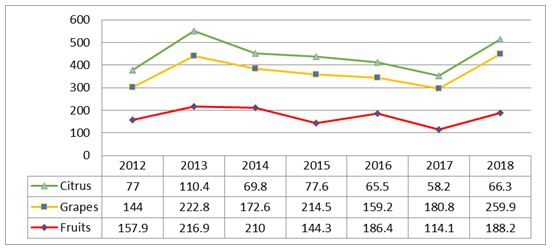
Source: National Statistics Office of Georgia
In regard to milk production, the politician oddly compares the 2018 figure to that of 2007. Therefore, we also analysed the production of animal husbandry products from 2007. In 2018, milk production decreased significantly (by 11.1%) as compared to 2007 and the production of meat decreased slightly (by 0.55%) whilst the production of eggs increased (by 44.9%). As compared to 2012, milk production decreased by 5.7%, meat production increased by 70.4% and, similarly, the production of eggs also increased (by 33.9%). As compared to 2017, the production of animal husbandry products increased in 2018.
Table 3: Production of Animal Husbandry Products in 2007-2018
|
Year |
Milk (Million Litres) |
Meat (Thousand Tons) |
Eggs (Million Pieces) |
|
2007 |
624.8 |
73 |
438.1 |
|
2012 |
589.5 |
42.6 |
474.0 |
|
2017 |
528.4 |
66.2 |
600.1 |
|
2018 |
555.3 |
72.6 |
634.8 |
Source: National Statistics Office of Georgia
In order to assess the situation in the agricultural sector in general, on the one hand, we need an analysis of the real agricultural growth rate (how the sector output changes excluding the impact of price changes) and, on the other hand, the share of agriculture in the total economy of the country; that is, the share it occupies in the gross domestic product.
In accordance with the preliminary data of 2018, the total domestic product created in the agricultural sector amounted to GEL 1,759 million in constant prices which is GEL 12.7 million (0.7%) more as compared to the same figure of 2017. In regard to the statistics of the last years, the highest figure for the real agricultural growth since 2012 was registered in 2013 when growth constituted 11.3% as compared to the previous year (agriculture decreased by 3.8% in 2012). Since 2013, the real agricultural growth rate is characterised with a decrease trend and dropped by 3.8% in 2017 instead of showing any growth.
In addition, the share of agriculture in the gross domestic product has been decreasing annually since 2013 and amounted to 7.7% of the total economy in 2018 (it was 8.6% in 2012, 9.4% in 2013 and 8.2% in 2017) which means that other sectors of the economy have increased faster as compared to agriculture. Therefore, it is possible to say that under increased funding in 2013-2018 (an increase in agricultural funding has started since 2012 and the agricultural sector’s expenses to the state budget payables ratio was 2.5% on average in 2012-2017 which was planned at 1.8% in 2018 and at 1.9% in 2019) the agricultural sector increased only marginally in absolute figures whilst the agriculture to total economy ratio has decreased.