Resume: According to 2018’s data, the real GDP in agriculture in constant prices amounted to GEL 1.759 million which is GEL 12.7 million (0.7%) more as compared to the same figure of 2017.
The highest rate of real agricultural growth was registered in 2013 when growth amounted to 11.3% as compared to the previous year. Since 2013, the agricultural growth rate has been decreasing with agriculture shrinking by 3.8% in 2017. In regard to 2018, as mentioned previously, the real GDP growth is only 0.7%.
The share of agriculture in Georgia’s GDP has been characterised with a decreasing trend since 2013 and amounted to 7.7% of the total economy in 2018. This means that other sectors of the economy have increased more rapidly as compared to agriculture.
In regard to sown areas, milk production and the number of livestock, they have indeed decreased (by 25.4%, 5.9% and 22.1%, respectively) although not by the percentage figures named by Mamuka Khazaradze.
Analysis
The founder of the public movement Lelo, Mamuka Khazaradze, whilst introducing new members of the movement, gave out his assessment of the agricultural sector and stated: “We have a deplorable situation in agriculture. The real GDP in agriculture has decreased. Therefore, sown areas shrank by 30%, the number of livestock decreased by 3% and milk production dropped by 3%. On top of that, our country, which has unique resources, imports USD 1 billion in agricultural products annually.”
Economic growth is measured by changes in the real added value in a country. Real agricultural growth (the change in the production volume as compared to the previous year) shows how the sector output has been altered without the impact of price changes. Therefore, in order to see progress in agriculture, it is appropriate to compare the real added value produced in the agricultural sector to the same figure of the previous year. Using this method excludes growth in value by increased prices (inflation). According to 2018’s data, the total GDP in agriculture in constant prices amounted to GEL 1.759 million which is GEL 12.7 million (0.7%) more as compared to the same figure of 2017.
The highest rate of real agricultural growth was registered in 2013 when growth amounted to 11.3% as compared to the previous year. Since 2013, the agricultural growth rate has been decreasing and agriculture shrank by 3.8% in 2017. In regard to 2018, as mentioned previously, the real GDP growth is only 0.7%.
Graph 1: Real Agriculture Growth in 2012-2018
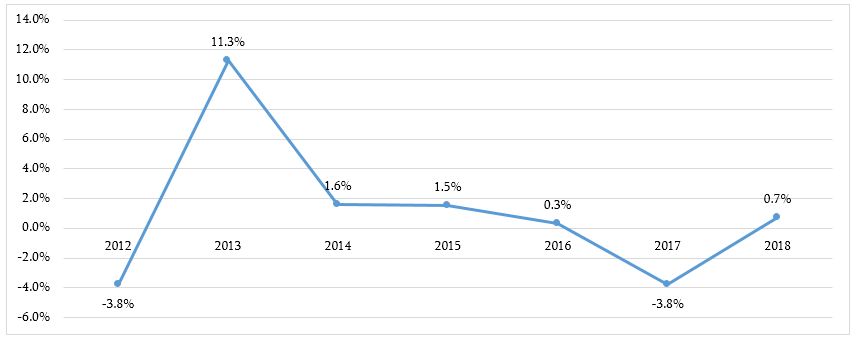
Source: National Statistics Office of Georgia
Graph 2: Share of Agriculture in the Gross Domestic Product in 2012-2018.
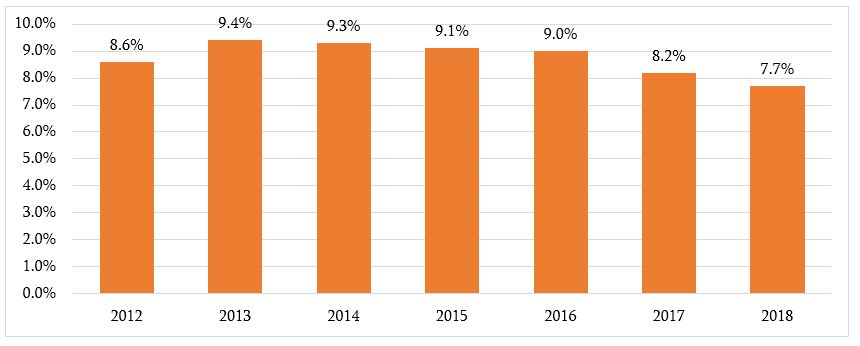
Source: National Statistics Office of Georgia
Mamuka Khazaradze has not specified in his statement which year’s data he is using. However, given the context, it is only logical to assume that in order to assess the agricultural sector under the Georgian Dream’s rule, he compares 2018’s data to 2012’s data (the last year of the United National Movement’s rule).
This year, Georgia’s sown area is 193,600 hectares which means that sown areas have shrunk by 25.4% as compared to 2012 and by 6.6% as compared to 2018. In 2013, total sown areas increased as compared to 2012 although we have seen a decrease trend in the following years (despite the Small Farmers Spring Work Assistance Programme which was active throughout 2013-2016 and halted by the government in 2017).
Table 1: Sown Areas (Thousand Hectares) in 2012-2019
|
Year |
Sown Area (Total) |
Autumn |
Spring |
|
2012 |
259.6 |
54.1 |
205.5 |
|
2013 |
310.7 |
52.5 |
258.2 |
|
2014 |
274.9 |
58.4 |
216.5 |
|
2015 |
263.7 |
56.2 |
207.5 |
|
2016 |
240 |
60.5 |
179.5 |
|
2017 |
220.3 |
53.6 |
166.6 |
|
2018 |
207.1 |
54.5 |
152.7 |
|
2019 |
193.6 |
52.1 |
141.5 |
Source: National Statistics Office of Georgia
In regard to the number of livestock, it was 1,128,800 in 2012 and dropped to 878,900 in 2018; that is, by 22.1%. As compared to 2017, there is a 3.4% drop in 2018.
Milk production was 589.5 million tonnes in 2012 whilst it was 555.3 million tonnes in 2018. Therefore, milk production decreased by 5.9% instead of 15% as claimed by Mr Khazaradze. As compared to 2017, milk production increased by 5% in 2018.
In his statement, Mamuka Khazaradze has also made an emphasis on the import of agricultural products.
Graph 3: Export and Import of Agri-Food Products in 2012-2018 (USD Million)
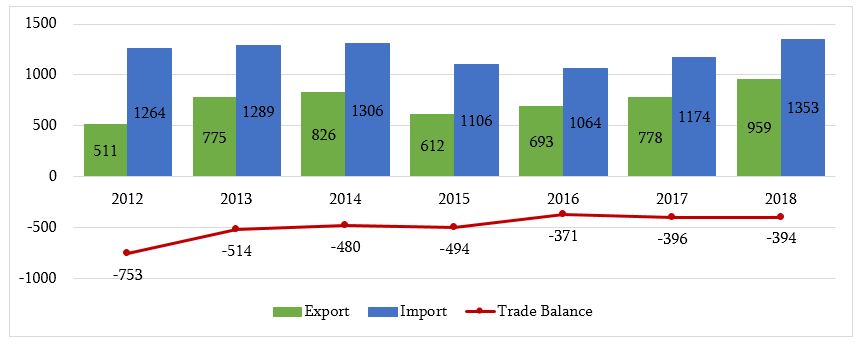
Source: National Statistics Office of Georgia
To summarise, it could be said that the agricultural sector increased only marginally in absolute figures under the increased funding in 2013-2018 whilst its share in the total economy has dropped.