

Resume: Although the absolute figures for export in the last years have a growth trend, imports are also growing annually. As a result, the trade deficit; that is, the difference between export and import has not been significantly reduced and fluctuates between nearly USD 5.7 billion to 5.1 billion. As of 2019’s data, the trade deficit amounted to USD 5.3 billion which was only USD 347 million more as compared to 2012’s figure whilst the trade deficit in 2018 was USD 5.8 billion which was only USD 101 million more as compared to 2012. Therefore, structurally speaking, Georgia still remains an export dependent country and the export growth effect in the GDP dynamic is cancelled by import growth.[1] In addition, the share of re-export in the total exports still remains high which structurally is not desirable.
That part of the Minister’s statement where he speaks about the trend of the reduction of the current account deficit does correspond to the truth. In particular, the current account deficit to GDP ratio reduced by 3.4% on average annually in 2012-2019.[2] However, the sharp growth of service export revenues (which is related mostly to tourism revenues) which nearly doubled in the last seven years accounts for the significant share in this trend. Therefore, the trade deficit effect in the current account is somewhat offset although the unfavourable structure of import dependence still remains a problem.
Analysis
On 5 May 2020, on air on TV Imedi’s broadcast Arena, the Minister of Finance of Georgia, Ivane Machavariani, stated (from 13:00): “Export dependency was significantly reduced. The current account deficit, which has been a chronic ailment of our economy, used to be within the margins of 12-13% and we closed the last year with it being within the margins of 4-5% which is a good indicator as this trend goes downward.”
Although the absolute figures for export have a growth trend in the last years, imports are also growing annually, As a result, the trade deficit; that is, the difference between export and import is not significantly reduced and fluctuates between nearly USD 5.7 billion to 5.1 billion. As of 2019’s data, the trade deficit amounted to USD 5.3 billion which was only USD 347 million more as compared to 2012’s figure whilst the trade deficit was USD 5.8 billion in 2018 which was only USD 101 million more as compared to 2012. Therefore, structurally speaking, Georgia still remains an export dependent country and the export growth effect in the GDP dynamic is cancelled by import growth.
Table 1: Net Export Structure in 2012-2019, USD Million
|
|
2012 |
2013 |
2014 |
2015 |
2016 |
2017 |
2018 |
2019 |
|
Export |
2,377 |
2,910 |
2,861 |
2,204 |
2,113 |
2,736 |
3,356 |
3,764 |
|
Import |
8,056 |
8,023 |
8,602 |
7,300 |
7,294 |
7,943 |
9,137 |
9,097 |
|
Trade Deficit |
-5,680 |
-5,112 |
-5,741 |
-5,096 |
-5,181 |
-5,207 |
-5,781 |
-5,333 |
Source: National Statistics Office of Georgia
Speaking about export figures, it is also important to determine the share of re-export in the total exports. All things being equal, export growth causes the growth of the gross domestic product (GDP). The effect of export goods production is also reflected in other components – employment increases and revenues are generated. Re-export has a marginal influence on creating jobs and on the growth of production which needs to be taken into account whilst analysing export. Re-export in itself is not a negative occurrence and its growth is a positive change. However, the net benefit from re-export is naturally less as compared to export. Therefore, re-export growth should be welcomed although its large share in the export structure is undesirable.
Graph 1: Export and Re-Export Dynamic in 2014-2019, USD Million
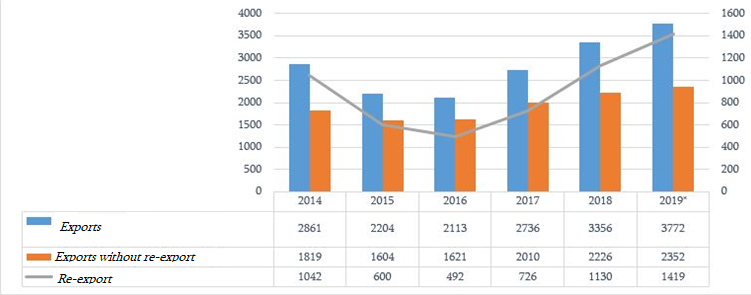
Source: National Statistics Office of Georgia
The growth of export in 2019 is marginal without re-export and constitutes USD 126 million. In this regard, the previous years were more successful and, therefore, export’s share in economic growth was more effective.
That part of the Minister’s statement where he speaks about the trend of the reduction of the current account deficit does correspond to the truth.[3] In particular, the current account deficit to GDP ratio reduced by 3.4% on average annually in 2012-2019. However, the sharp growth of service export revenues (which is related mostly to tourism revenues) which nearly doubled in the last seven years accounts for the significant share in this trend. Therefore, the trade deficit effect in the current account is somewhat offset although the unfavourable structure of import dependence still remains a problem.
Table 2: Current Account Dynamic and Structure in 2012-2019, USD Million
|
|
2012 |
2013 |
2014 |
2015 |
2016 |
2017 |
2018 |
2019 |
|
Current Account |
-1,886.0 |
-958.0 |
-1,789.0 |
-1,763.0 |
-1,885.0 |
-1,308.0 |
-1,191.0 |
-897.0 |
|
Goods |
-4,216.0 |
-3,492.0 |
-4,270.0 |
-3,934.0 |
-3,869.0 |
-3,800.0 |
-4,111.0 |
-3,727.0 |
|
Services |
1,094.0 |
1,399.0 |
1,285.0 |
1,390.0 |
1,564.0 |
2,014.0 |
2,241.0 |
2,161.0 |
|
Revenues |
-172.0 |
-317.0 |
-229.0 |
-338.0 |
-701.0 |
-795.0 |
-684.0 |
-704.0 |
|
Current Transfers |
1,407.0 |
1,451.0 |
1,425.0 |
1,119.0 |
1,121.0 |
1,273.0 |
1,363.0 |
1,372.0 |
|
Current Account (GDP %) |
-11.4 |
-5.6 |
-10.2 |
-11.8 |
-12.4 |
-8.0 |
-6.8 |
-5.1 |
Source: National Bank of Georgia
[1] Net export; that is, the difference between export and import is one of the components of the GDP. GDP=I+C+G+NX where I is investments, C is consumption, G is government spending and NX is net export.
[2] As a result of the change in the methodology in 2019, the official GDP ratio data were amended for a number of indicators. Therefore, the past cited data are different which is not an error. See: https://factcheck.ge/ka/story/38263-რამ-გამოიწვია-მშპ-ს-მონაცემის-3-5-მლრდ-ლარით-ზრდა
[3] A country’s balance of payments includes comprehensive data about money inflows and outflows. It also illustrates the movement of money between the economy of a specific country and the rest of the world. A country’s balance of payments consists of its current account, capital account and financial account.