

MANIPULATION: Georgia is Among the Top Ten Countries with the Highest Rate of Unemployment
Verdict: MANIPULATION
Information with a manipulative headline: Georgia is among top ten countries with the highest rate of unemployment is circulated through media and the Facebook social network.
On 14 May 2021, the International Labour Organisation (ILO) updated unemployment statistics which includes data from 186 countries and territorial units. These statistics reflect the unemployment rate in various countries/territorial units in different years. In the case of Georgia, the data includes the unemployment rate for 2020 whilst in most cases unemployment figures are taken from the years before 2020 (2019 and 2014-2018) and the outbreak of the pandemic (these are the latest available unemployment figures for countries). Therefore, a comparison of unemployment rates between different countries/territorial units is manipulative and distorts the real picture.
Of note is that the pandemic-induced global crisis and the ensuing restrictions in 2020 negatively affected the unemployment rate. In 2020, the unemployment rate in Georgia increased by 0.9 of a percentage point to 18.5%. Notwithstanding the fact that the comparison of data for different years is inappropriate, the juxtaposition of the pre-pandemic period and the period after the outbreak of the pandemic distorts the real picture even further. For instance, Georgia’s unemployment rate is slightly higher (0.2 of a percentage point) in these statistics as compared to Armenia’s because the 2019 figure (the pre-pandemic unemployment rate) is used vis-à-vis the latter. In fact, the unemployment rate was lower (17.6%) in Georgia in 2019 than in Armenia (18.3%).
According to the ILO’s data, Georgia ranks 13th among 186 countries in terms of unemployment. However, such a comparison is inappropriate as mentioned earlier.
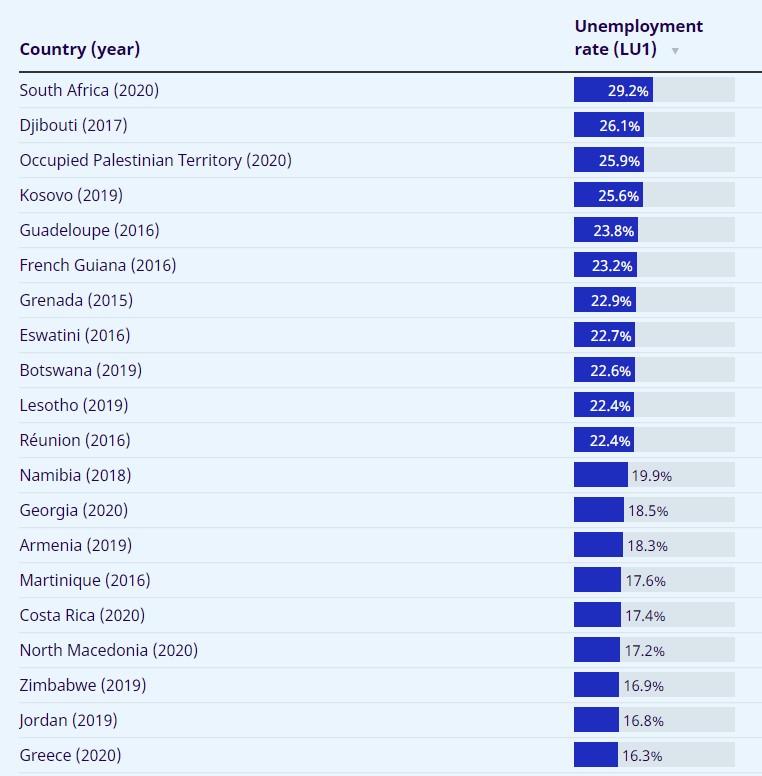
Source: International Labour Organization
Another reason why it is wrong to compare the data of different countries is because of the unemployment measurement methodology. The new ILO standard which was introduced in Georgia last year, uses the technical growth of unemployment and the reduction of the employment rate. This methodology gives a more accurate description of the situation in the country. However, it is not suited for a comparison with countries which use a different methodology to measure unemployment statistics. The ILO-suggested new unemployment measurement standard officially entered into force in October 2018 at the 20th International Conference of Labour Statisticians. The methodology has already been introduced in some countries but not everywhere.
The National Statistics Office of Georgia uses the ILO methodology for compiling employment and unemployment statistics. At the end of 2020, Georgia moved to the ILO-suggested new standard and employment/unemployment statistics were recalculated. The new standard envisioned a re-categorisation of self-employed people. In particular, people employed in domestic households who are not market-focused and produce agriculture output largely for their own consumption are no longer considered as self-employed according to the new standard.
The unemployment rate (percentage figure) is the unemployed people to the workforce ratio. For a further clarification, the workforce (the economically active population) is the total sum of employed people and those looking for jobs. A person who is unemployed but does not look for a job (was not looking for a job in a four-week period prior to the survey) ends up outside of the workforce and is no longer considered as unemployed. As a result of the recalculation conducted in accordance with the new methodology, some self-employed persons who are no longer considered as employed were included in the unemployed category and some of them ended up outside of the workforce. Therefore, the number of unemployed individuals increased whilst the workforce; that is, the economically active population, decreased which caused a sharp growth in the unemployment rate.
Graph 1: Unemployment Rate (%) in 2010-2019 According to Old and New Methodologies
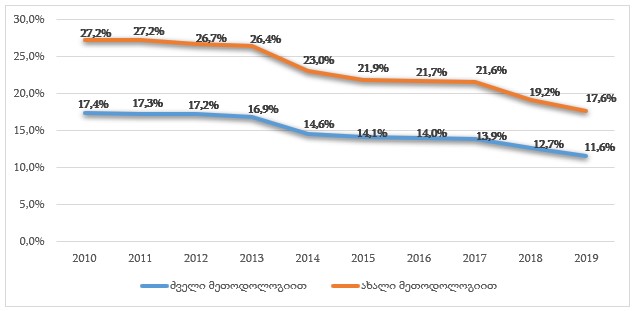
Source: National Statistics Office of Georgia
Therefore, the headline of the aforementioned information is manipulative for two reasons. First, a comparison of data for different years, in particular those before and after the pandemic, does not show the real picture and second, the employment measurement methodology varies in different countries and it is inappropriate to use the data of such countries for comparison.
------------------------------------------------------------------------------------------------------------
This article was produced as part of Facebook’s Fact-checking Programme. Given the rating, Facebook may impose different restrictions – click here for full information. For information on issuing a correction or to dispute a rating, please see here.