

In time, money’s purchasing power decreases as a result of inflation and currently one can buy less goods and services with GEL 1 than was previously possible. This process is called inflation. Given certain needs, different indicators can be used to measure inflation. For instance, consumer, producer and export-import price indices are used for the calculation of the real gross domestic product. Consumer inflation is measured by the Consumer Price Index.
The current high inflation rate problem is very problematic for the population, particularly amid the pandemic which is associated with economic restrictions. According to September 2021’s data, the annual inflation rate is 12.3%. In September 2021, core inflation [1] amounted to 6.3% as compared to the same period of the previous year. Table 1 shows annual inflation in terms of the prices of groups of consumer goods.
Table 1: Percentage Changes in Prices of Groups of Goods and Services in the Consumer Basket and Their Share in the Total Inflation Rate of September 2021
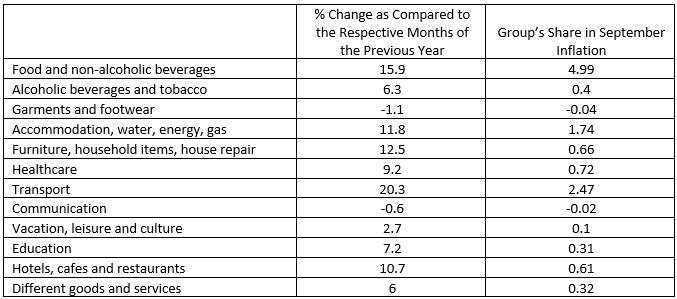
Source: National Statistics Office of Georgia
According to the information of the National Statistics Office of Georgia, the annual inflation was largely affected by the price changes in the following groups: food and non-alcoholic beverages where prices increased by 15.9% which was reflected on the annual inflation by 4.99 percentage points. Prices in the transport group of services increased by 20.3% which contributed to 2.47 percentage points of growth of the total inflation rate. Accommodation, water, energy, gas: there was an 11.8% growth in the prices in this group which was added 1.74 percentage points to the annual inflation rate and prices in the group of healthcare services increased by 9.2% and added 0.72 of a percentage point to the annual index. Of note is that prices decreased for communication and garments/footwear in the last year.
In total, these 12 groups consist of 305 goods and they make up the list of the most widely consumed goods and services whilst depicting the structure of expenses of the country’s average consumer according to a clarification of the National Statistics Office of Georgia. Table 2 shows 40 individual goods/services which became the most expensive in the last year.
Table 2: 40 individual goods/services which became the most expensive in the last year.
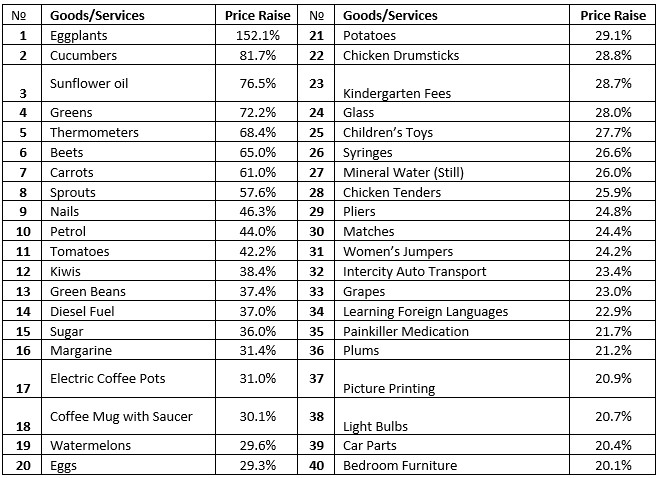
Source: Geostat.ge
[1] Core inflation is measured by excluding the following groups of goods and services from the consumer basket: food and non-alcoholic beverages, energy, administered tariffs, transport (certain tariffs).